Customer churn is one of the main challenges for telecom companies, especially in subscription-based models where retention directly affects revenue and sustainable growth.
In this context, simply knowing how many customers left is not enough. The most important question is understanding who is leaving, when it happens and which customer characteristics are most associated with churn risk.
The goal of this project was to analyze customer behavior and identify the main factors associated with churn, creating a clear view of vulnerable customer groups and possible retention actions.
The analysis was guided by three core questions: what is the current churn level, which factors influence cancellation the most, and what actions can be taken to reduce this risk.
The first step was to explore the data using SQL, analyzing overall churn distribution, behavior by contract type, customer tenure, monthly charges and payment method.
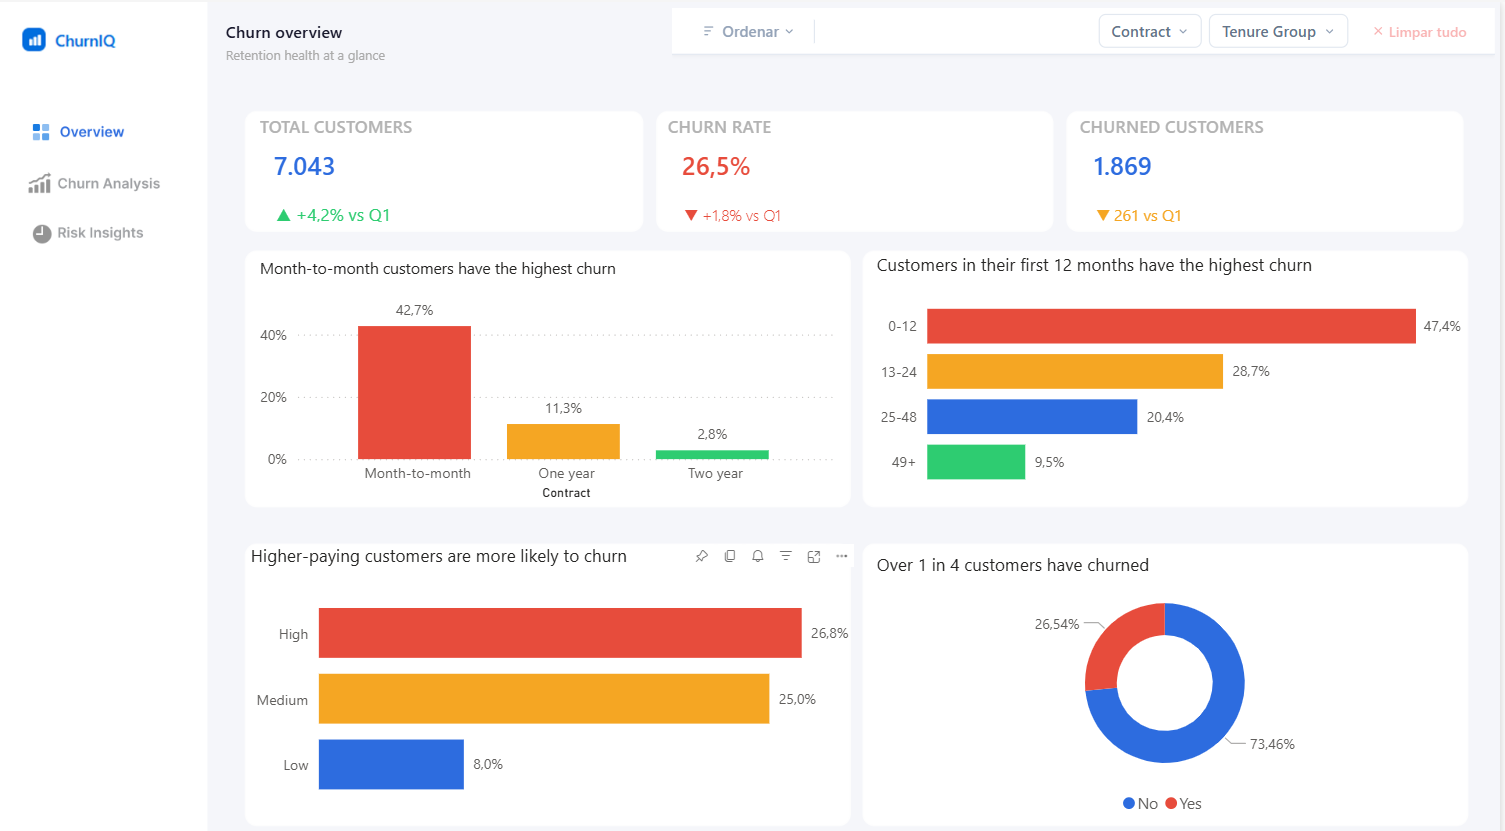
Then, I developed a Power BI dashboard structured into three pages: overview, churn driver analysis and risk segmentation with recommendations. The goal was to create a simple executive narrative connecting metrics, behavioral patterns and business actions.
- The dataset contains 7,043 customers.
- 1,869 customers discontinued their services.
- The overall churn rate identified was 26.5%.
- More than 1 in 4 customers in the dataset had churned.
- Month-to-month customers showed significantly higher churn than customers on annual or two-year contracts.
- Customers in their first 12 months had the highest churn risk, suggesting a critical point in the early customer experience.
- Customers with higher monthly charges showed a higher tendency to churn, suggesting potential value perception issues.
- Electronic check users had higher churn than customers using automatic payment methods.
- Customers without tech support showed higher churn, reinforcing the role of customer experience in retention.
The combination of customer tenure and contract type showed that customers within 0 to 12 months on month-to-month contracts represent the most critical group in the analysis.
On the other hand, customers on two-year contracts showed very low churn rates, reinforcing the relationship between contract commitment and customer retention.
- Prioritize onboarding actions during the first months, with closer follow-up and reduced initial friction.
- Encourage migration to long-term contracts through benefits, discounts or exclusive advantages.
- Review value perception for high-paying customers by communicating service benefits more clearly.
- Investigate possible friction in payment methods associated with higher churn, especially electronic check.
- Strengthen tech support as part of the customer experience and retention strategy.
This case turns a churn dataset into a practical business view, showing not only the volume of cancellations but also the customer profiles with higher risk and the most relevant retention actions.
The result is a decision-oriented dashboard focused on clarity, prioritization and business impact.
View full dashboard